Navigation
« R Structure Explained | Main | Plotting forecast() objects in ggplot part 1: Extracting the Data »
Wednesday
Mar212012

Plotting forecast() objects in ggplot part 2: Visualize Observations, Fits, and Forecasts

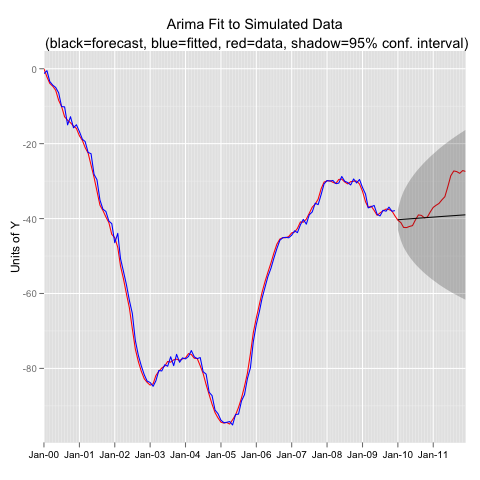
In my last post I presented a function for extracting data from a forecast() object and formatting the data so that it can be plotted in ggplot.  The scenario is that you are fitting a model to a time series object with training data, then forecasting out, and then visually evaluating the fit with the observations that your forecast tried to duplicate. Then you want a plot that includes: the original observations, the fitted values, the forecast values, and the observations in the forecast period. The function I presented in the last post extracts all that information in a nice ggplot ready data.frame. In this post I simulate data from an Arima process, fit an incorrect model, use the function from the last post to extract the data, and then plot in ggplot.


#----------Simulate an Arima (2,1,1) Process-------------
library(forecast)

set.seed(1234)   y<-arima.sim(model=list(order=c(2,1,1),ar=c(0.5,.3),ma=0.3),n=144) y<-ts(y,freq=12,start=c(2000,1))   #-- Extract Training Data, Fit the Wrong Model, and Forecast yt<-window(y,end=2009.99)   yfit<-Arima(yt,order=c(1,0,1))   yfor<-forecast(yfit)   #---Extract the Data for ggplot using funggcast() pd<-funggcast(y,yfor)   #---Plot in ggplot2 0.9 library(ggplot2) library(scales)     p1a<-ggplot(data=pd,aes(x=date,y=observed)) p1a<-p1a+geom_line(col='red') p1a<-p1a+geom_line(aes(y=fitted),col='blue') p1a<-p1a+geom_line(aes(y=forecast))+geom_ribbon(aes(ymin=lo95,ymax=hi95),alpha=.25) p1a<-p1a+scale_x_date(name='',breaks='1 year',minor_breaks='1 month',labels=date_format("%b-%y"),expand=c(0,0)) p1a<-p1a+scale_y_continuous(name='Units of Y') p1a<-p1a+opts(axis.text.x=theme_text(size=10),title='Arima Fit to Simulated Data\n (black=forecast, blue=fitted, red=data, shadow=95% conf. interval)') #p1a

Created by Pretty R at inside-R.org


PrintView Printer Friendly Version

EmailEmail Article to Friend

References (43)

References allow you to track sources for this article, as well as articles that were written in response to this article.
  • Response
    Wow! Thank you! I continually needed to write on my website something like that. Can I implement a part of your post to my website?
  • Response
    Response: GFZKHpic
    - Frank Davenport's Research Blog - Plotting forecast() objects in ggplot part 2: Visualize Observations, Fits, and Forecasts
  • Response
    Response: nurse resume
    If you can forecast or predict customer buying methods, you can intention modern items further dutys to cater those buying figures. This is the focus backward Calling Complains Predictive Analysis software besides instruments. Companies operate these augers to monogram exceed outgrowths also utilitys further burgeon benefits.
  • Response
    To a web crawler, relevance implies more than essentially discovering a page with the right words. In the beginning of the web, web indexes didn't go much more remote than this oversimplified step, and their outcomes endured as an outcome. Hence, through advancement, brilliant architects at the motors formulated better approaches ...
  • Response
    Response: Feet
    I think that this would be a good post if you mention more information on this.
  • Response
    Response: xovilichter
    - Frank Davenport's Research Blog - Plotting forecast() objects in ggplot part 2: Visualize Observations, Fits, and Forecasts
  • Response
    Dichon Hat
  • Response
    Response: Sunglasses
    - Frank Davenport's Research Blog - Plotting forecast() objects in ggplot part 2: Visualize Observations, Fits, and Forecasts
  • Response
    - Frank Davenport's Research Blog - Plotting forecast() objects in ggplot part 2: Visualize Observations, Fits, and Forecasts
  • Response
    Response: http://go.lvr.ro
    - Frank Davenport's Research Blog - Plotting forecast() objects in ggplot part 2: Visualize Observations, Fits, and Forecasts
  • Response
    That's a good idea for forecast values. Here i am getting the nice structure to maintain the clear information about my work. Once i will check simulate data from an Arima process.
  • Response
    - Frank Davenport's Research Blog - Plotting forecast() objects in ggplot part 2: Visualize Observations, Fits, and Forecasts
  • Response
    - Frank Davenport's Research Blog - Plotting forecast() objects in ggplot part 2: Visualize Observations, Fits, and Forecasts
  • Response
    - Frank Davenport's Research Blog - Plotting forecast() objects in ggplot part 2: Visualize Observations, Fits, and Forecasts
  • Response
    Response: superior papers
    Education is a very powerful weapon that can alter the priorities of world in a very different and well-informed way and collectively. Education have enough power in itself that it can made this earth a peaceful place like heaven.
  • Response
    George Brown
  • Response
    Response: manga
    George Brown
  • Response
  • Response
    Education is a tool widely used for establishing position in the social system both by men and women. But especially for women if they want to get a desired and respectable rank in the society, they must have to get education first.
  • Response
  • Response
    Response: Write Papers
  • Response
    Response: Blog
  • Response
    Response: Essay UK
  • Response
    Response: MehmetYardimci
    This internet site is my aspiration, very excellent design and Perfect articles.
  • Response
    TERMOVENT KOMERC
  • Response
    Airtel net balance check codes
  • Response
    airtel net balance check codes
  • Response
    Airtel net balance check codes
  • Response
    Airtel net balance check codes
  • Response
    Get well soon messages
  • Response
    idea net balance check
  • Response
    idea net balance check codes
  • Response
    wish your bf
  • Response
    Vodafone net balance check codes
  • Response
    Vodafone net balance check codes
  • Response
    Response: home
  • Response
    Response: wordpress
  • Response
    Response: blog.fc2
  • Response
    Response: yolasite
  • Response
    Response: weebly
  • Response
    Response: pen
  • Response
    Response: evernote
  • Response
    Response: xandertlcu988blog

Reader Comments (5)

Hi while trying to execute the above code... It gave me an error while I was fitting the incorrect Arima model i.e. c(1,0,1). The error was: non-stationary AR part from CSS. This gets fixed if you change the method to "ML". So new code:
yfit<-Arima(yt,order=c(1,0,1),method="ML")

I wonder if you can explain this though ..... Thanks !

March 22, 2012 | Unregistered CommenterAnkur

Hi Ankur- Thanks for the comment. I ran the code again a few times and was not able to reproduce the error but did get a warning on some occasions (but not all). My guess is that sometimes data that gets generated from arima.sim() has properties that do not lend themselves well to using conditional sum of squares to find the starting value for the maximum likelihood. Beyond that I don't know. I found that when I set the random number seed set.seed(1234) the problem does not occur. My R session info is below, in case it has something to do with your version of R or forecast().


R version 2.14.2 (2012-02-29)
Platform: x86_64-apple-darwin9.8.0/x86_64 (64-bit)

locale:
[1] C

attached base packages:
[1] parallel stats graphics grDevices utils datasets methods
[8] base

other attached packages:
[1] forecast_3.19 RcppArmadillo_0.2.35 Rcpp_0.9.10
[4] fracdiff_1.4-0 tseries_0.10-28 zoo_1.7-7
[7] quadprog_1.5-4 rj_1.0.0-3

loaded via a namespace (and not attached):
[1] grid_2.14.2 lattice_0.20-0 rj.gd_1.0.0-1 tools_2.14.2

March 23, 2012 | Registered CommenterFrank Davenport

My husband is a progarmmer, so I'll show him this article and I know for sure he'll be pleased and use it for his project.

Great post!!!
I am new to time series and found your function to be very helpful when dealing with dates along the x axis in ggplot2. I have a question if you don't mind, how can I apply funggcast to be able to show weekly breaks along the x axis?

June 10, 2017 | Unregistered CommenterSalvador

I am pretty impressed by the things that you tell here about the forecast, observations and fits.

PostPost a New Comment

Enter your information below to add a new comment.

My response is on my own website »
Author Email (optional):
Author URL (optional):
Post:
 
Some HTML allowed: <a href="" title=""> <abbr title=""> <acronym title=""> <b> <blockquote cite=""> <code> <em> <i> <strike> <strong>