In the last post I presented a function for recovering marginal effects of interaction terms. Here we implement the function with simulated data and plot the results using ggplot2.
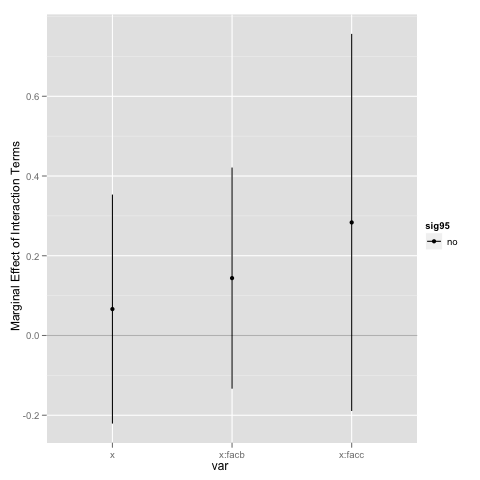
#---Simulate Data and Fit a linear model with an interaction term
y<-rnorm(100,5,1)
x<-rnorm(100,5,1)
d<-data.frame(y=y,x=x,fac=sample(letters[1:3],100,replace=T))

mod<-lm(y~x*fac,data=d)

#========================================================

#---Extract the Main Effects, including the baseline, into a data.frame
dusp<-funinteff(mod,'x') #returns a data.frame of the Estimate and Standard Error, row.names correspond to the variables

#----Now Set the data up to visualize in ggplot-----
library(ggplot2)
#------Quick ggplot (move into graph code later)
#quick convenience function to compute significance at .95
funsig<-function(d){
	tstat<-abs(d$b/d$se)
	sig<-ifelse(tstat>=1.96,'yes','no')
	return(sig)
}


names(dusp)[1:2]<-c('b','se') #change the names to to make typing easier

#Add confidence intervals and signficance test
dusp$hi<-dusp$b+1.96*dusp$se
dusp$lo<-dusp$b-1.96*dusp$se
dusp$sig95<-funsig(dusp)

dusp$var<-row.names(dusp)


pd<-dusp

p1<-ggplot(data=pd,aes(x=var,y=b,shape=sig95))
p1<-p1+geom_hline(yintercept=0,col='grey')+geom_line()
p1<-p1+geom_pointrange(aes(ymin=lo,ymax=hi)) #+coord_flip() #uncomment coord_flip to switch the axes
p1<-p1+scale_y_continuous(name='Marginal Effect of Interaction Terms')
Created by Pretty R at inside-R.org